Individual Hitters in College Softball
Individual Hitting Performance: Power vs. On-Base Ability
Welcome to our college softball analytics website! Before analyzing team records and divisional differences, we begin with the fundamental building blocks of softball offense: the individual hitters.
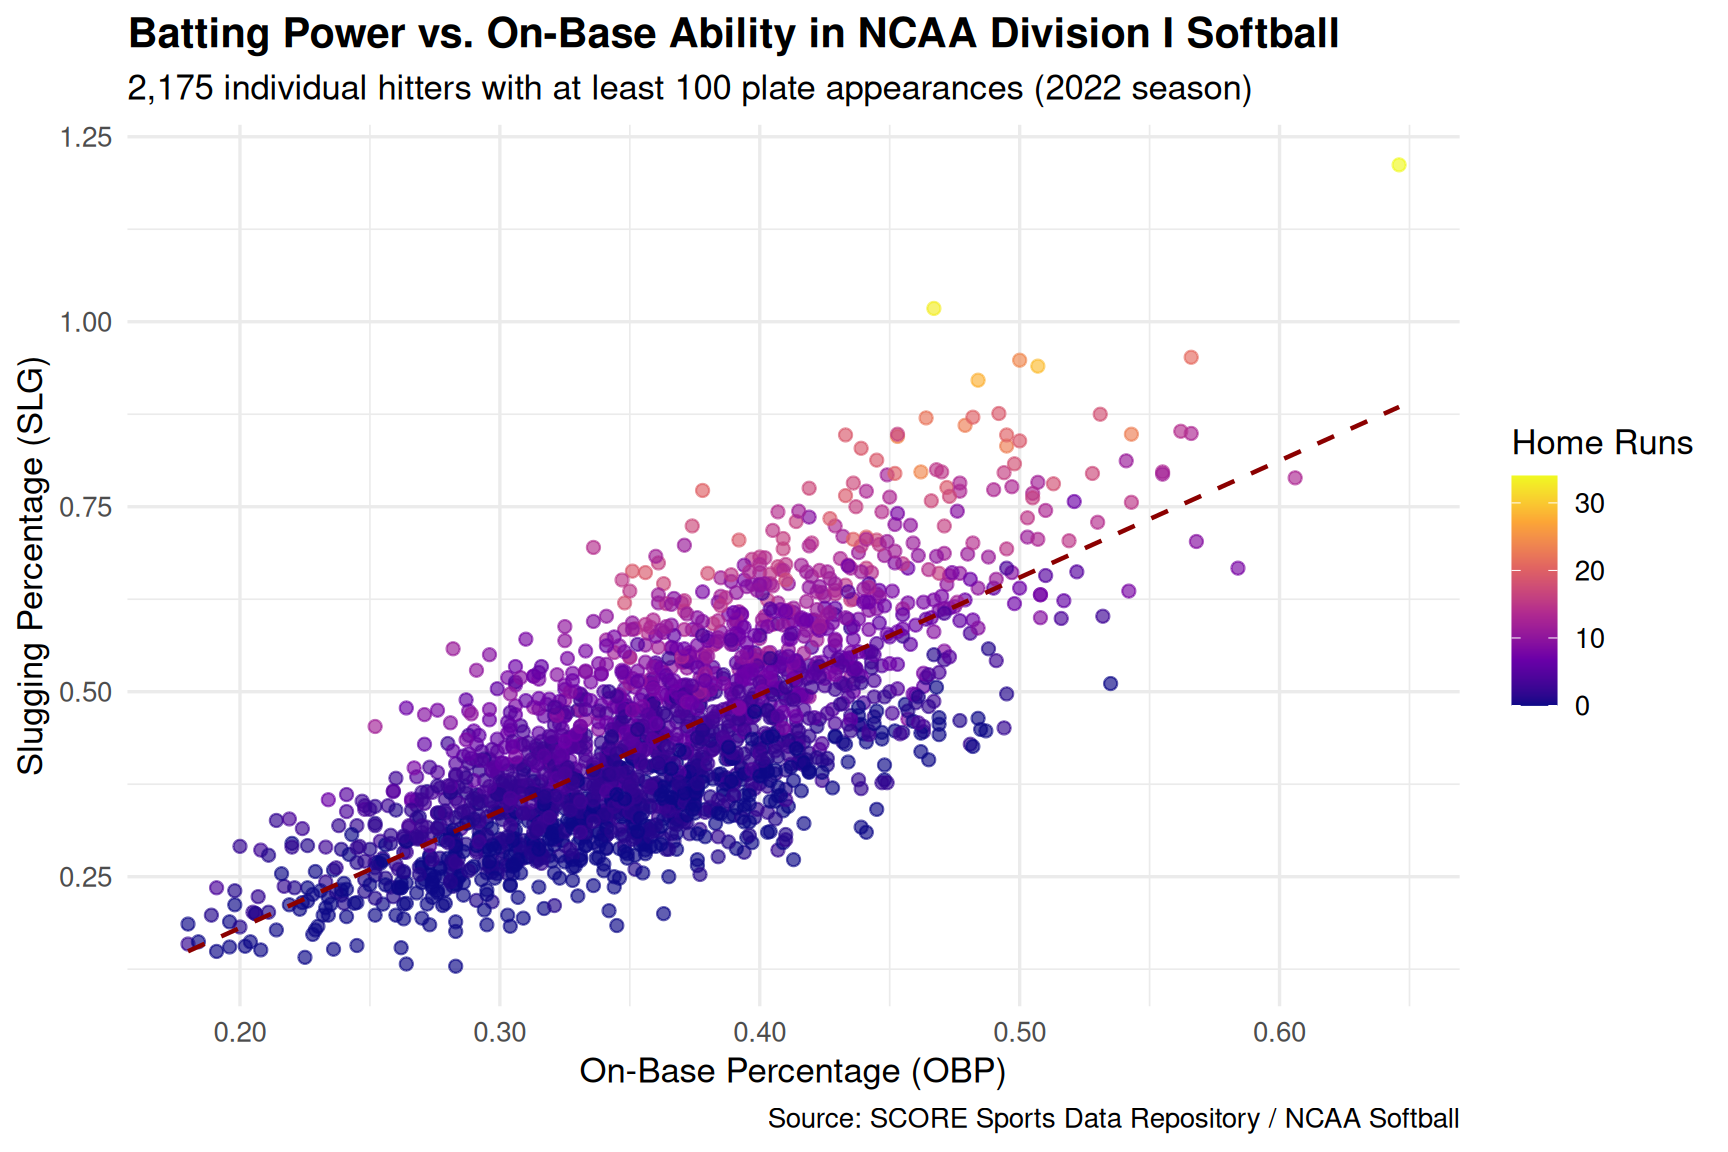
Below are 2,175 individual NCAA Division I hitters from the 2022 season (minimum 100 plate appearances). We examine the relationship between on-base ability (OBP) and power (Slugging Percentage, SLG), shaded by total home runs hit.
Key Takeaways from Individual Data
- Power and on-base skills rise together: Hitters who get on base at elite rates (.400+ OBP) also tend to slug significantly higher (.600+ SLG).
- The impact of the long ball: Players in the highest home run tier (bright yellow points, 15+ HRs) dominate the upper-right quadrant of offensive production.
- From individual hitters to team success: While individual hitters drive run production, does stacking home run power actually guarantee team victories across different divisions of college softball?
Explore our full findings across the site:
- Check out the Story tab for a division-by-division analysis (D1, D2, D3, and JUCO) comparing home run rates to game outcomes.
- Use the Exploration tab to interactively filter teams and examine the data yourself.