The Story: Home Run Power vs. Game Outcomes
Does Home Run Percentage Drive Winning Across College Softball?
After analyzing individual hitters on the homepage, our central research question turns to team performance: Does a higher team home run percentage lead to winning more games, especially when facing teams with lower home run production?
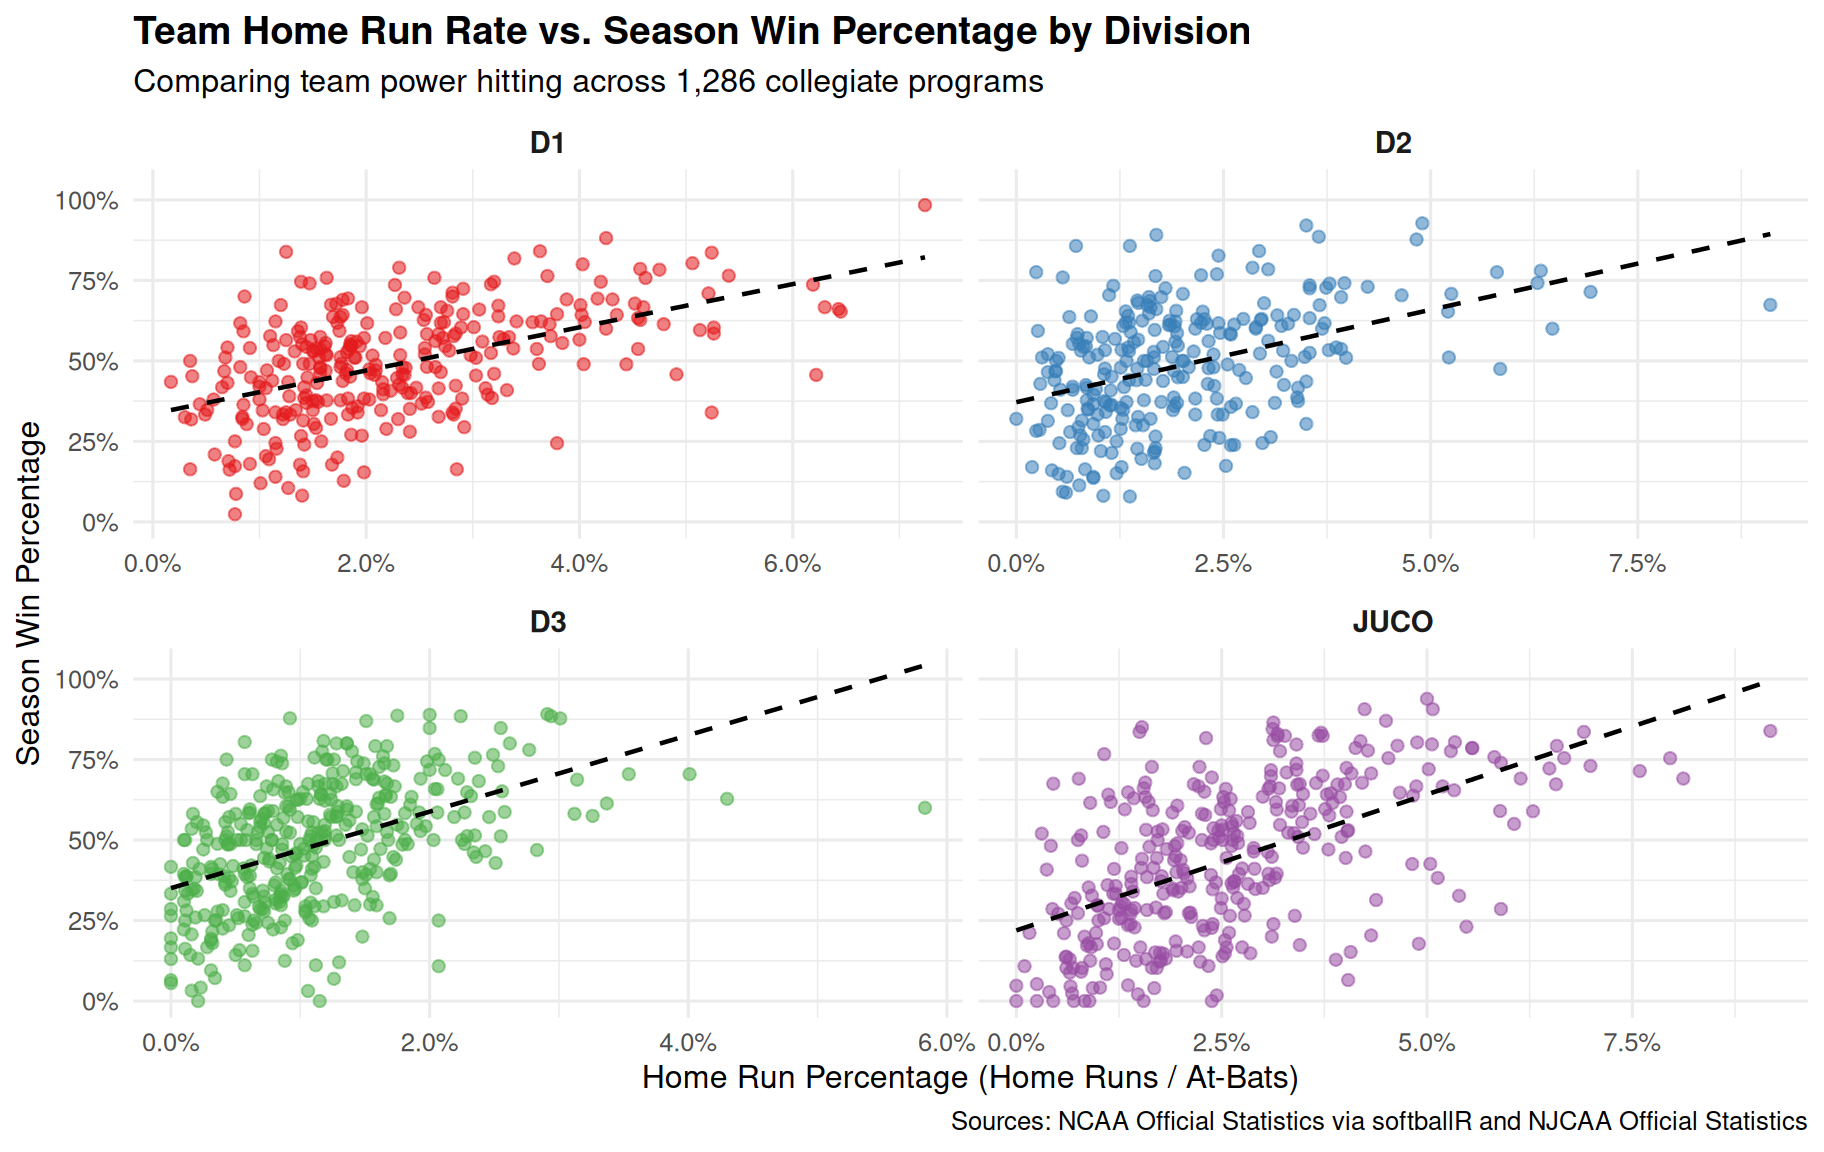
To answer this, we analyze 1,286 college softball teams across four divisions: - NCAA Division I (295 teams) - NCAA Division II (262 teams) - NCAA Division III (391 teams) - Junior College / NJCAA (338 teams)
Across all four levels, there is a clear, positive upward slope: teams that hit home runs at higher rates consistently win a higher percentage of their games.
Division-by-Division Analysis
NCAA Division I
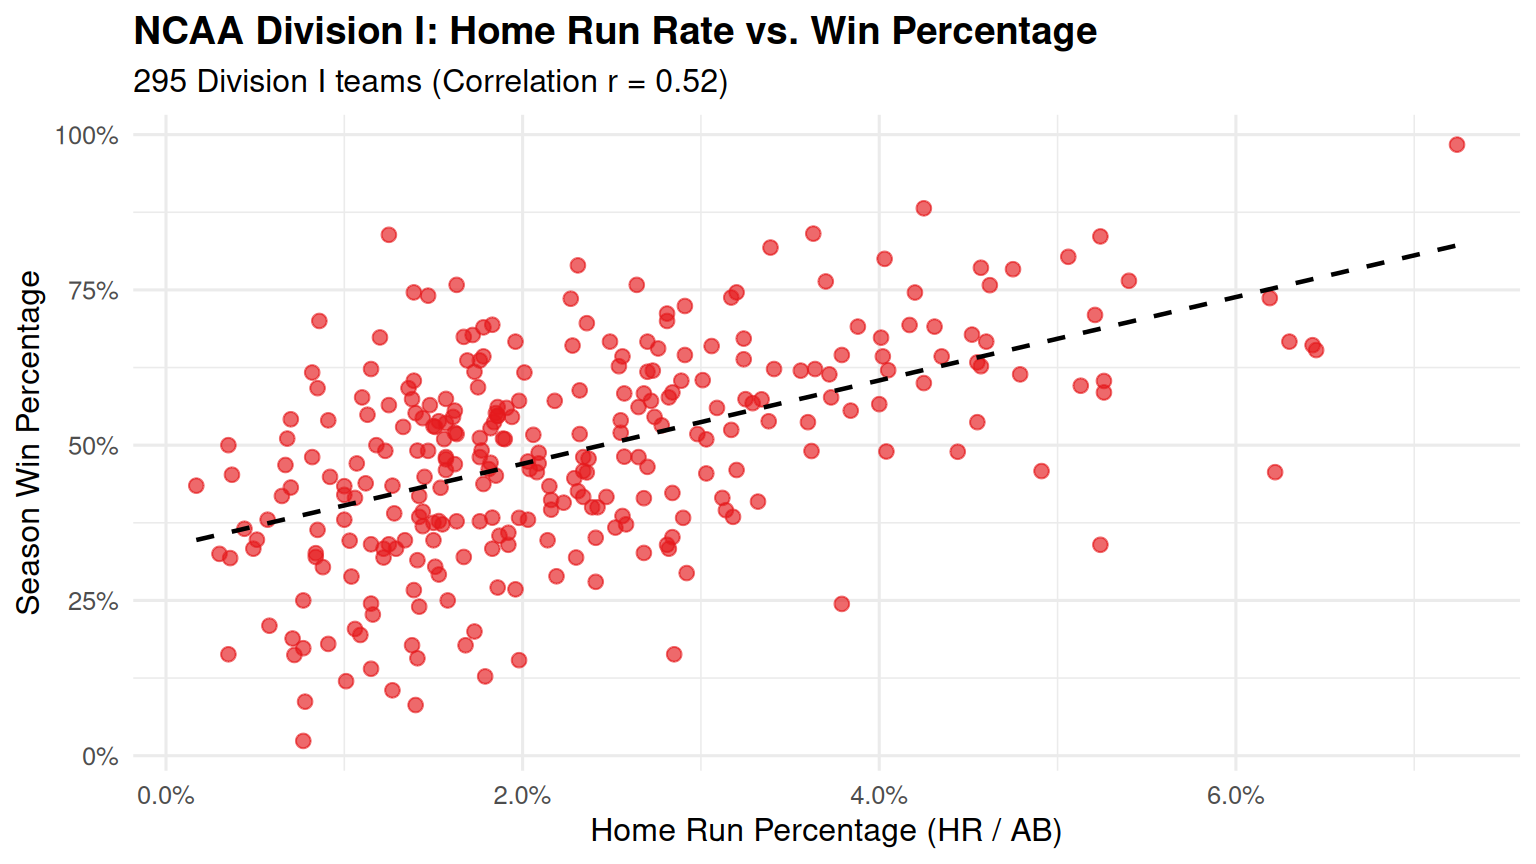
- Statistical correlation: \(r = 0.52\), indicating a strong positive relationship.
- Median benchmark: The median Division I team hit home runs in 1.96% of their at-bats.
- Impact on game outcomes: Division I teams in the upper half of home run rate win 55.5% of their games, compared to just 42.7% for teams in the lower half — a 12.8 percentage point advantage.
- Head-to-head dynamic: When a high-home-run D1 team plays a low-home-run opponent, the power advantage creates immediate multi-run innings against high-velocity pitching, shifting game odds heavily toward the power-hitting squad.
NCAA Division II
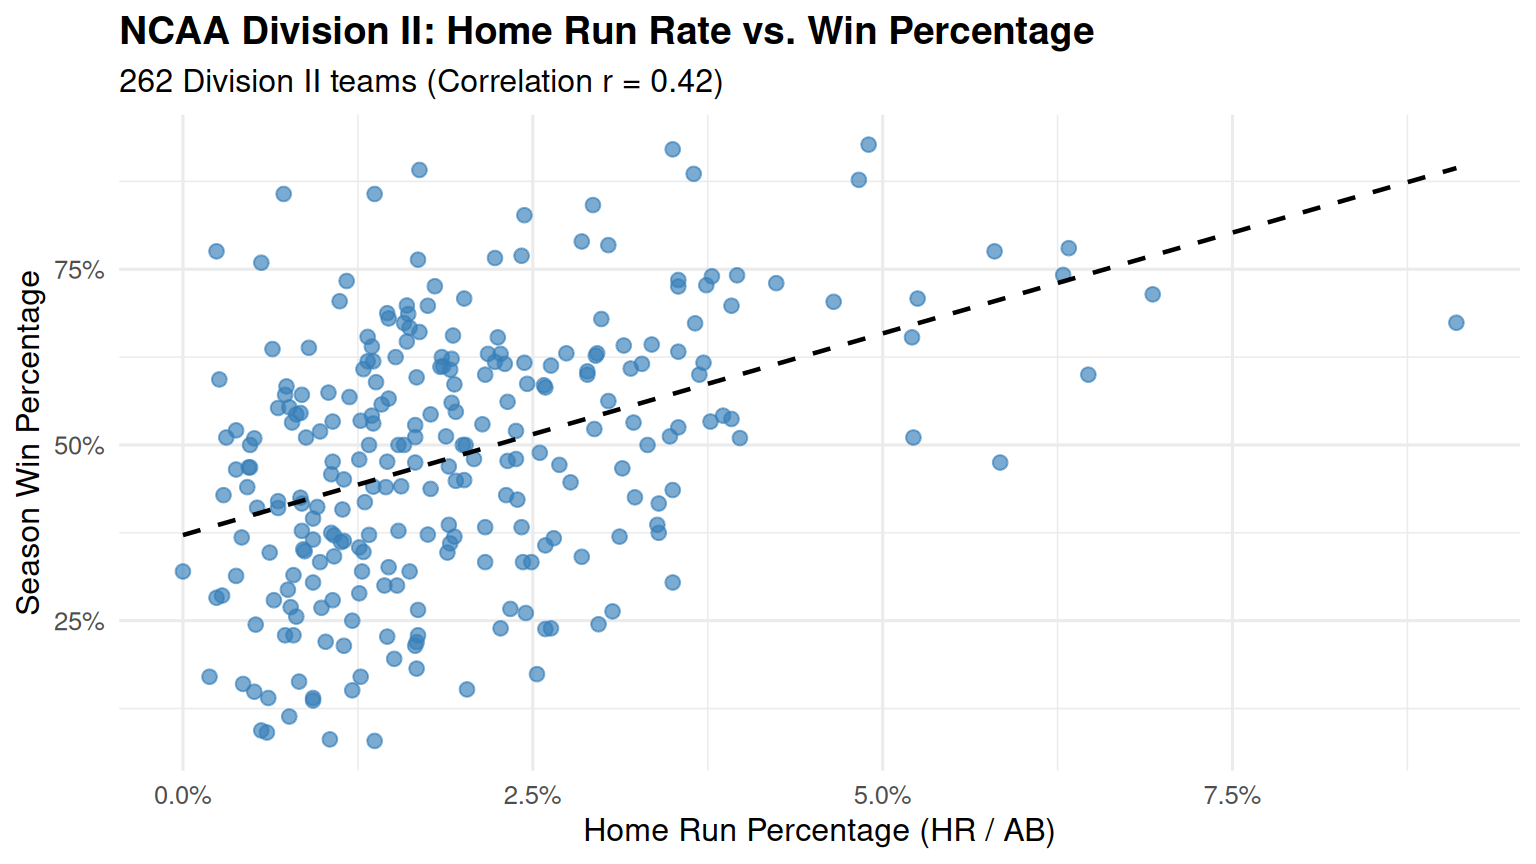
- Statistical correlation: \(r = 0.42\).
- Median benchmark: The median Division II team maintains a home run rate of 1.67%.
- Impact on game outcomes: Teams above the median win 55.1% of their games, compared to 42.2% for below-median teams (12.9 percentage point advantage).
- Head-to-head dynamic: In Division II, teams that maintain a 3.0%+ home run rate almost never finish below a .500 win rate. When facing lower-power teams, their ability to score without relying on stringing 3–4 consecutive singles together provides a reliable winning edge.
NCAA Division III
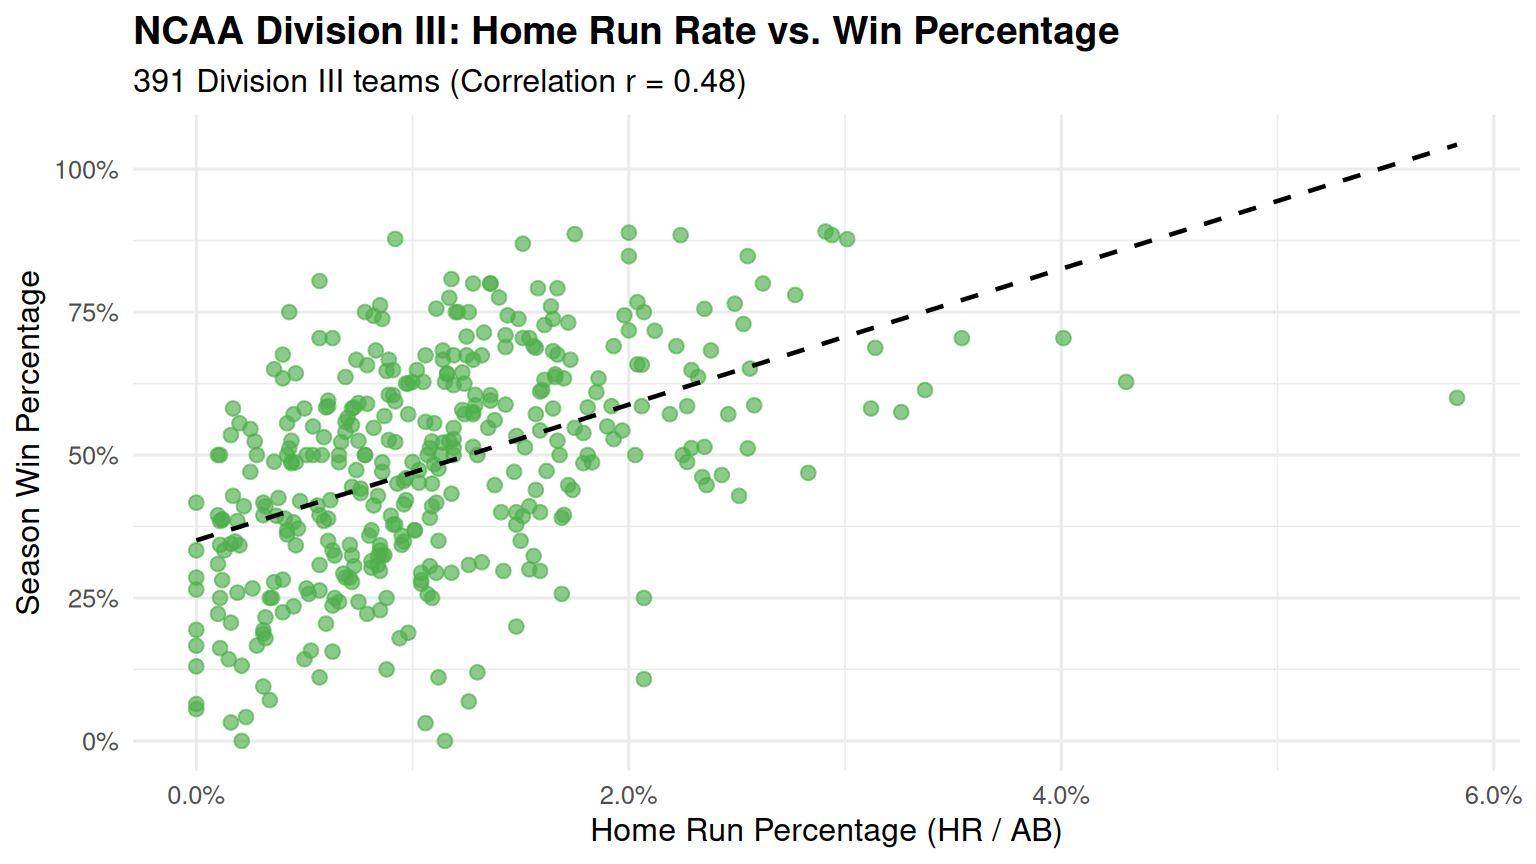
- Statistical correlation: \(r = 0.48\) with the steepest regression slope (\(\beta = 11.9\)).
- Median benchmark: The median home run rate in Division III is just 1.00%, the lowest of any collegiate division.
- Impact on game outcomes: Teams above the median win 56.2% of their contests, while teams below the median win only 40.6% (15.6 percentage point advantage).
- Head-to-head dynamic: Because power is so scarce in Division III, home runs act as a “super-weapon.” A single multi-run home run often decides an entire contest against an opponent that lacks home run capability.
Junior College (JUCO / NJCAA)
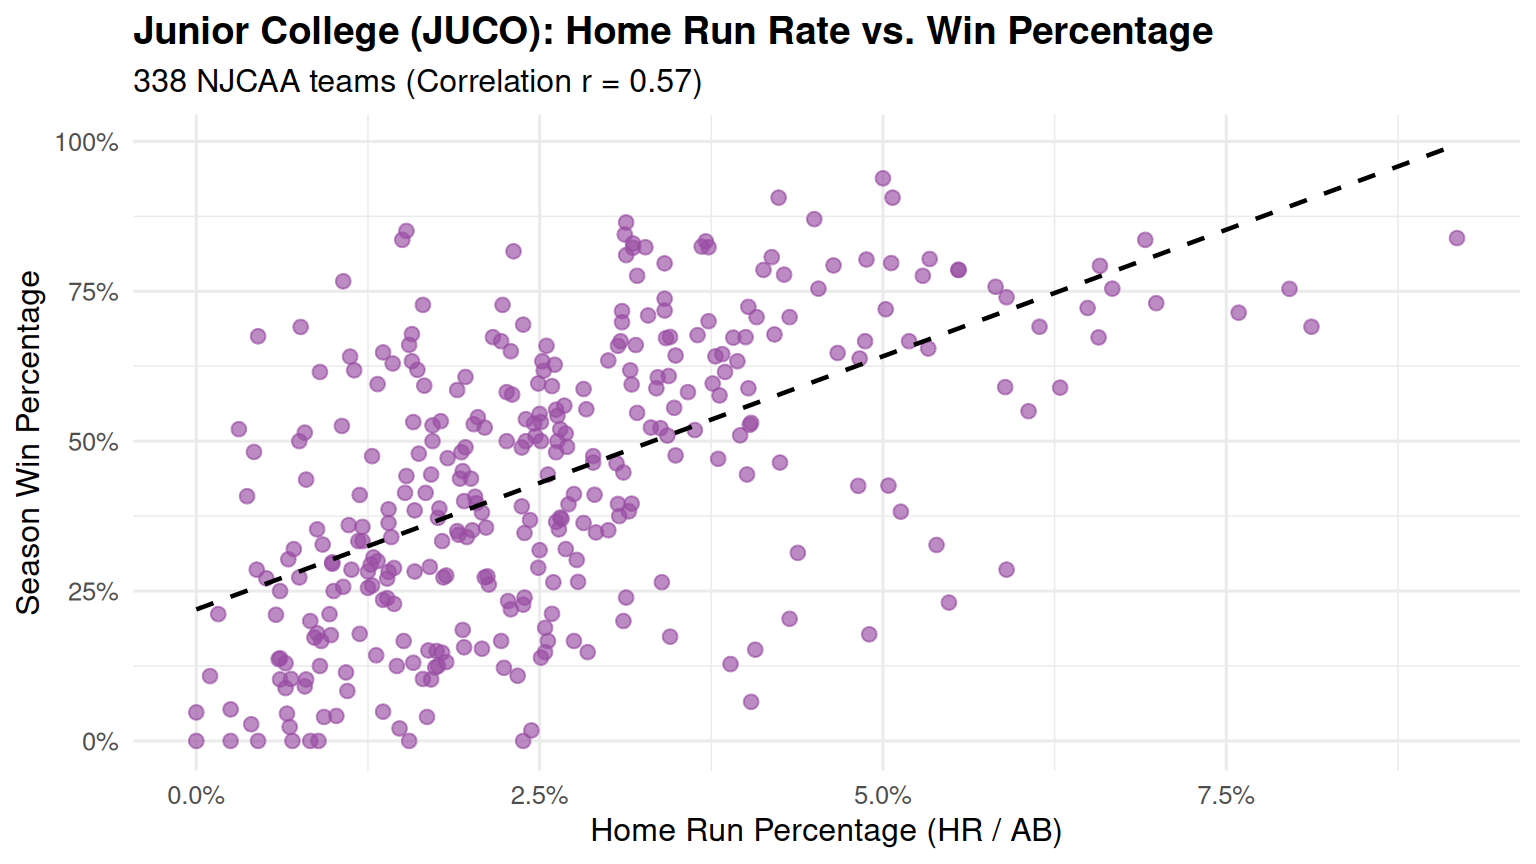
- Statistical correlation: \(r = 0.57\), the strongest correlation among all divisions.
- Median benchmark: The median JUCO team posts a 2.39% home run rate, the highest collegiate median.
- Impact on game outcomes: Teams above the median win 55.1% of games, whereas teams below the median win just 32.6% — a massive 22.5 percentage point chasm.
- Head-to-head dynamic: In the offensive-heavy JUCO environment, low-home-run teams struggle immensely to keep up on the scoreboard. When a higher-power team meets a lower-power team, the higher-power team wins nearly two-thirds of the time.
Conclusion: Higher Home Run Percentage Decisively Impacts Game Outcomes
Across all 1,286 teams in college softball:
- Consistent Advantage: In every division, teams in the top half of home run percentage win between 12.8 and 22.5 percentage points more games than teams in the bottom half.
- Game Outcome Differential: When a high-home-run team plays a low-home-run team, the high-power team holds a substantial probability advantage. Power hitting generates unearned run potential, forces opposing pitchers into stressful counts, and turns deficits into leads with a single swing.